
- Electrochemical Workstation (e.g., Potentiostat/Galvanostat)
- Three-Electrode System:
- Working ElectrodeGlassy Carbon Electrode (GCE)
- Reference ElectrodeSilver/Silver Chloride (Ag/AgCl)
- Counter ElectrodePlatinum Wire or Mesh
- Electrolyte Solution: 0.1 M PBS Phosphate Buffer Solution (pH 7.0)
- Nitrate Standard Solutions: Sodium nitrate,Various concentrations (e.g., 1 mM, 5 mM, 10 mM)
- Environmental Sample: Water sample with potential nitrate contamination
- Deionized Water
- Glassware: Beakers, pipettes, and volumetric flasks
- pH Meter
- Protective Equipment: Lab coat, gloves, safety glass
Theory
Cyclic voltammetry (CV) is an electrochemical technique used to study the redox behavior of chemical species
by sweeping the potential of a working electrode between two set values in a cyclic manner and measuring the
resulting current. In CV, the potential (E) of the working electrode is varied linearly over time, and the
resulting current (I) is recorded to generate a voltammogram. The typical cyclic voltammetry experiment
involves applying a potential E(t)that changes according to the following equation:
E(t)=E0+νt
Cyclic voltammetry involves applying a voltage to an electrode immersed in an electrolyte solution, and seeing
how the system responds. In CV, a linear sweeping voltage is applied to an aqueous solution containing the
compound of interest. A linear sweeping voltage is defined by the voltage (or potential) being varied linearly
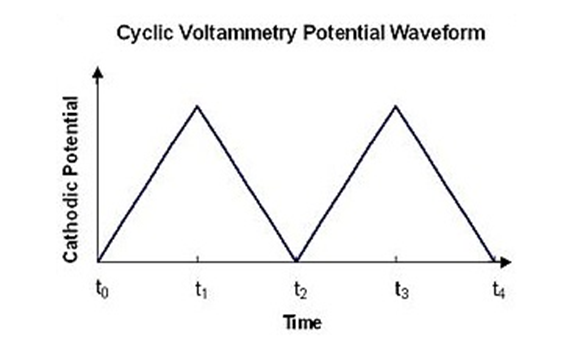
at the speed of the scan rate Figure 1 illustrates the voltage variation. The voltage flips sign and the
potential reverses when it reaches a maximum value, becoming the maximum voltage. The potential of the working
electrode is swept linearly between two values (the start and end potentials) at a constant rate (scan rate).
This sweep can be forward (positive potential) and reverse (negative potential), creating a cyclic waveform.As
seen in Figure 1, the changeover occurs at the peak. The procedure can then be carried over again in a
cyclical or periodic fashion.
 As seen in above graph, the changeover occurs at the
peak. The
procedure can then be carried over again in a
cyclical or periodic fashion.
As seen in above graph, the changeover occurs at the
peak. The
procedure can then be carried over again in a
cyclical or periodic fashion.