T1
15.9°C
T2
75.5°C
T4
13°C
T3
41°C
T5
-16.5°C
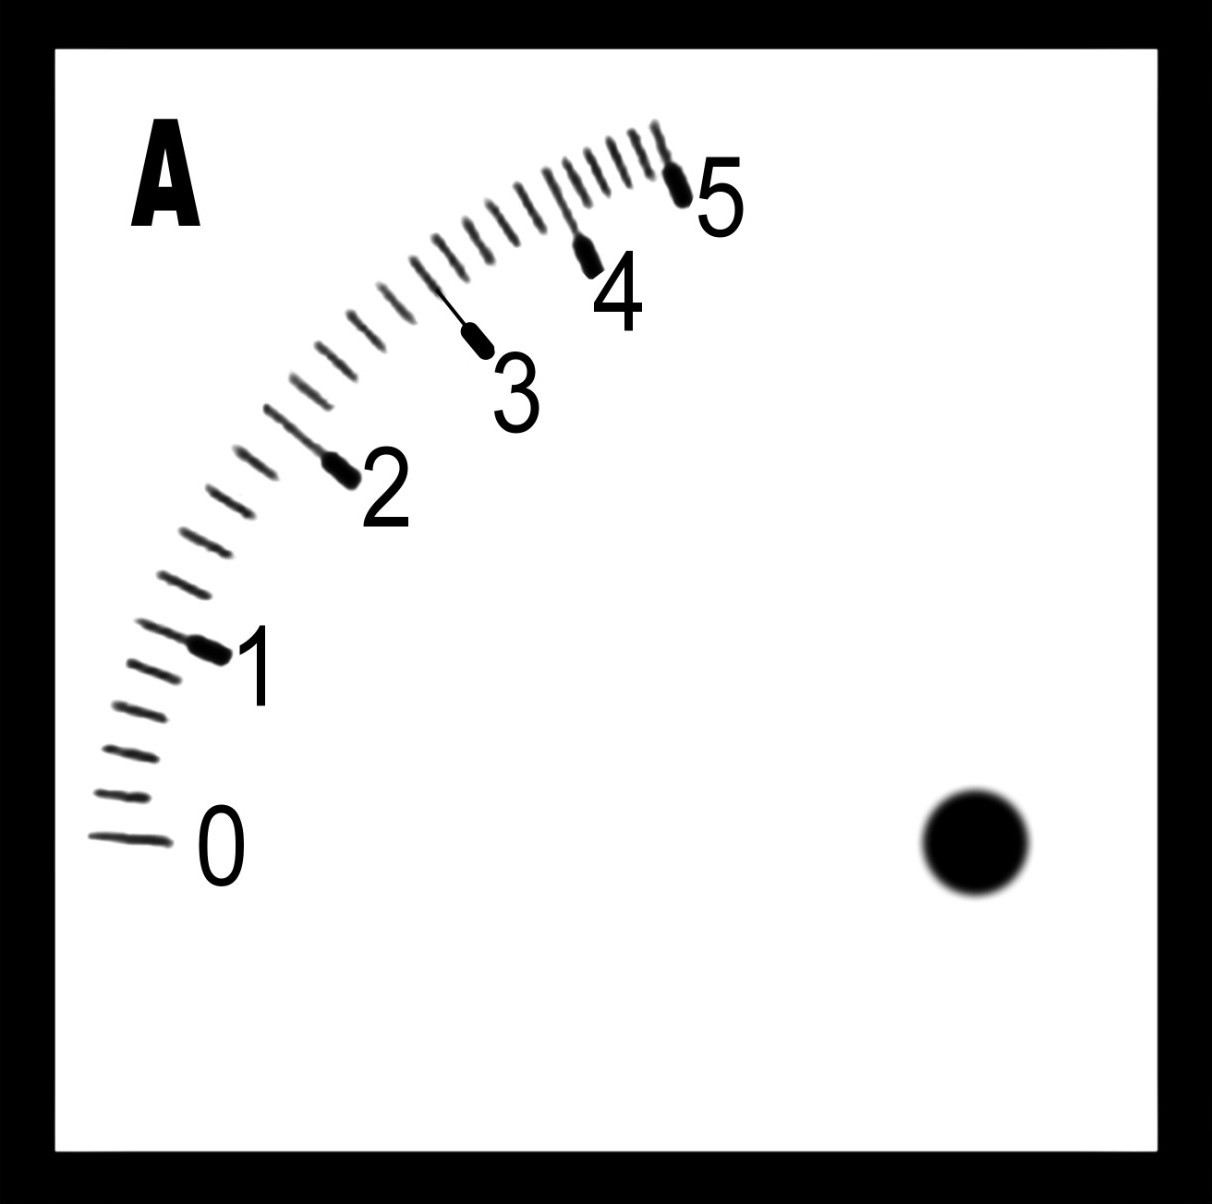

Ammeter
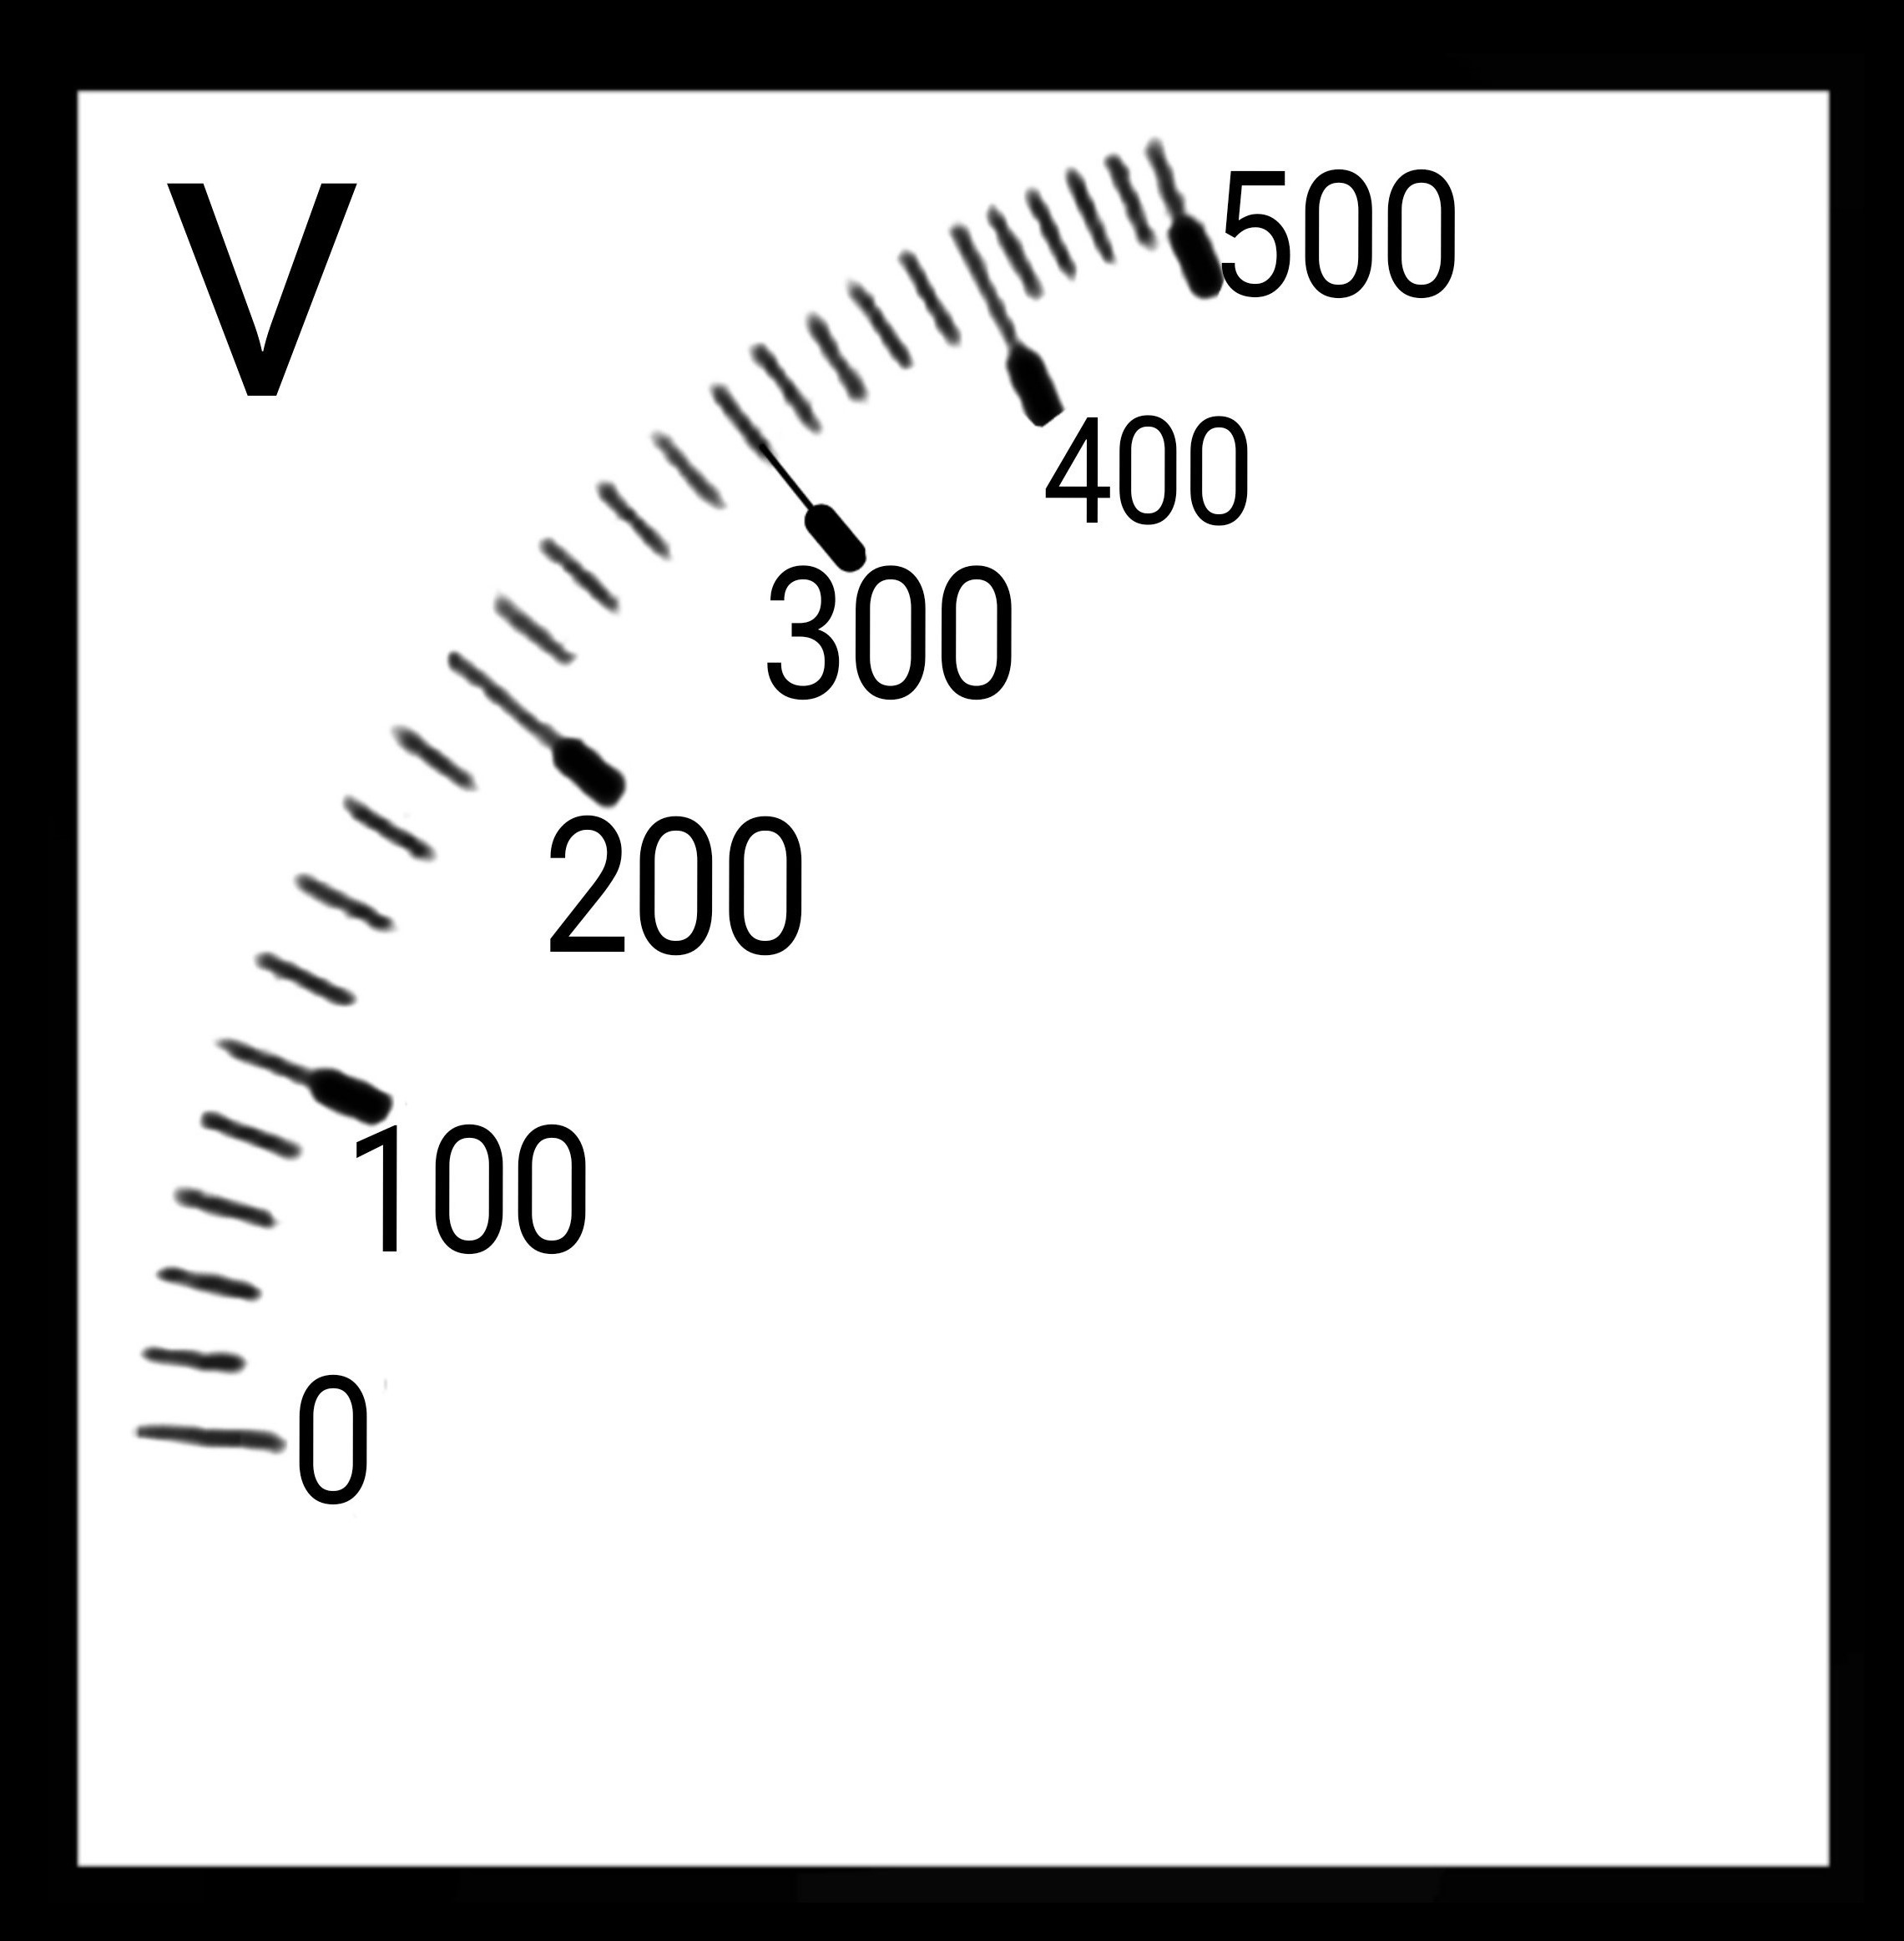
Voltmeter
21.2
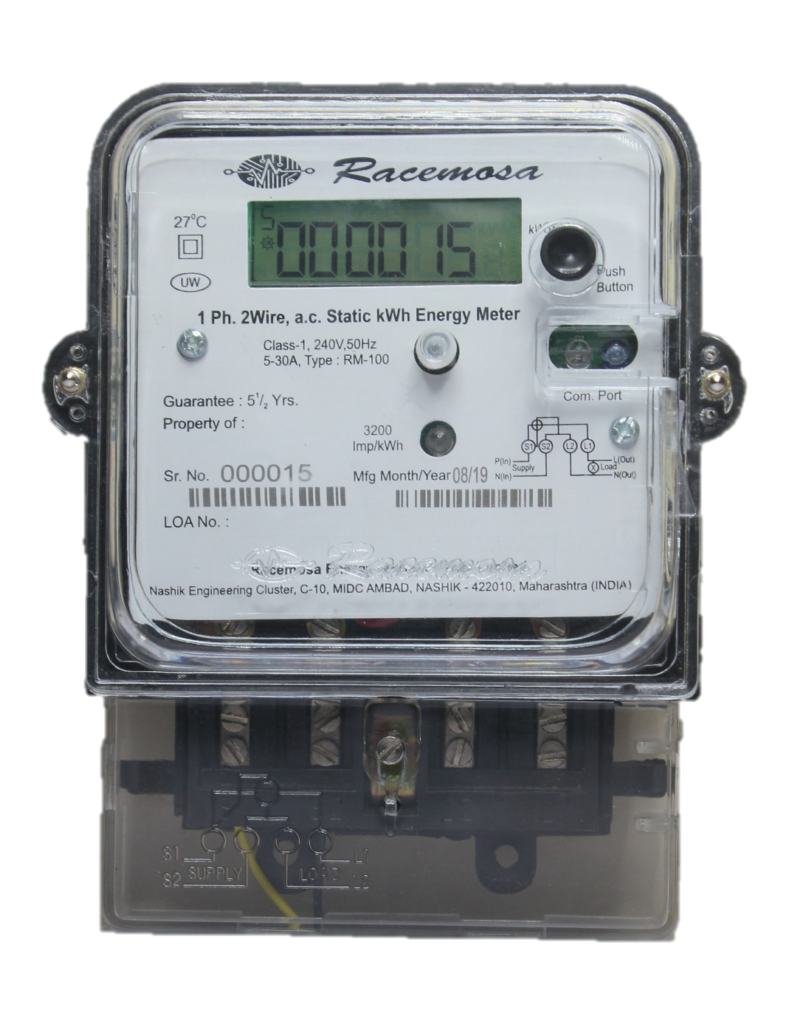

24.8
Heater Meter
Compressor Meter
compressor
heater
TIMER
00:00
T3
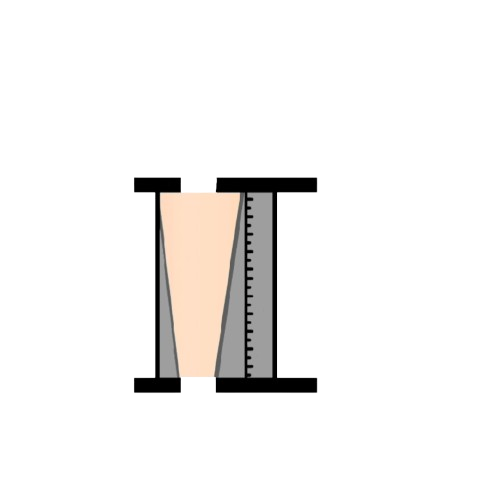
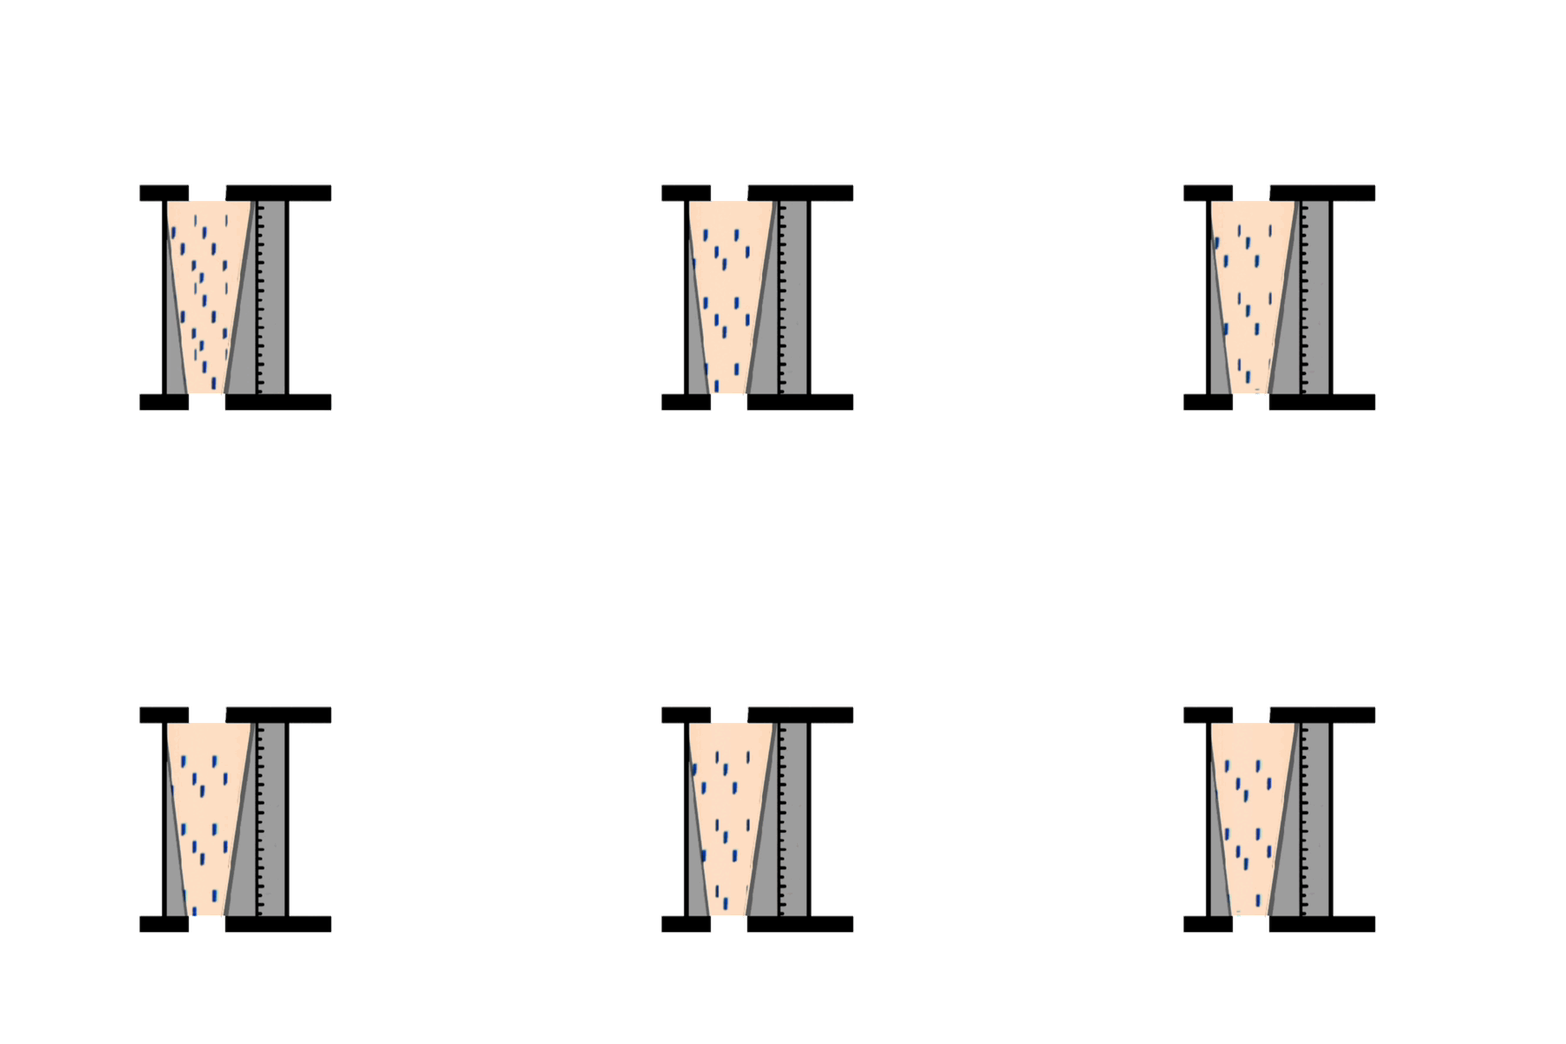

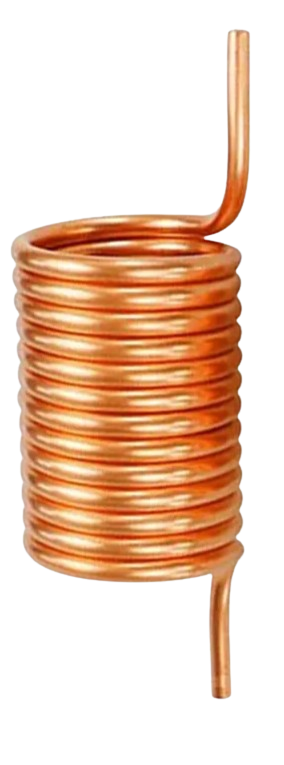
Expansion Valve
Rotameter

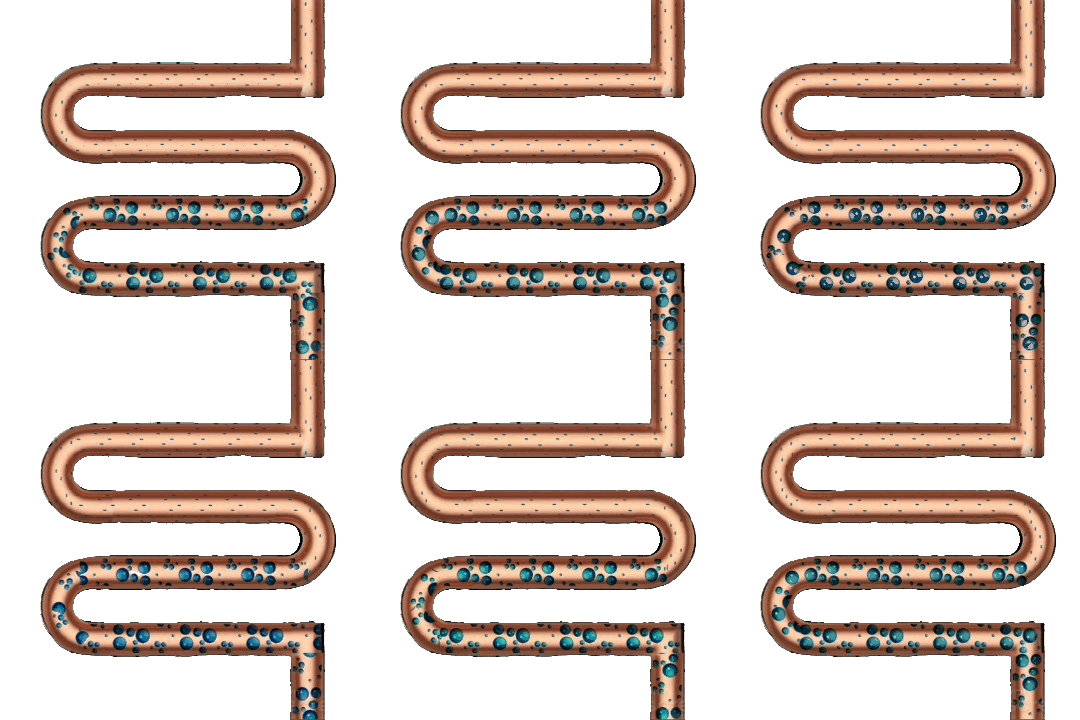

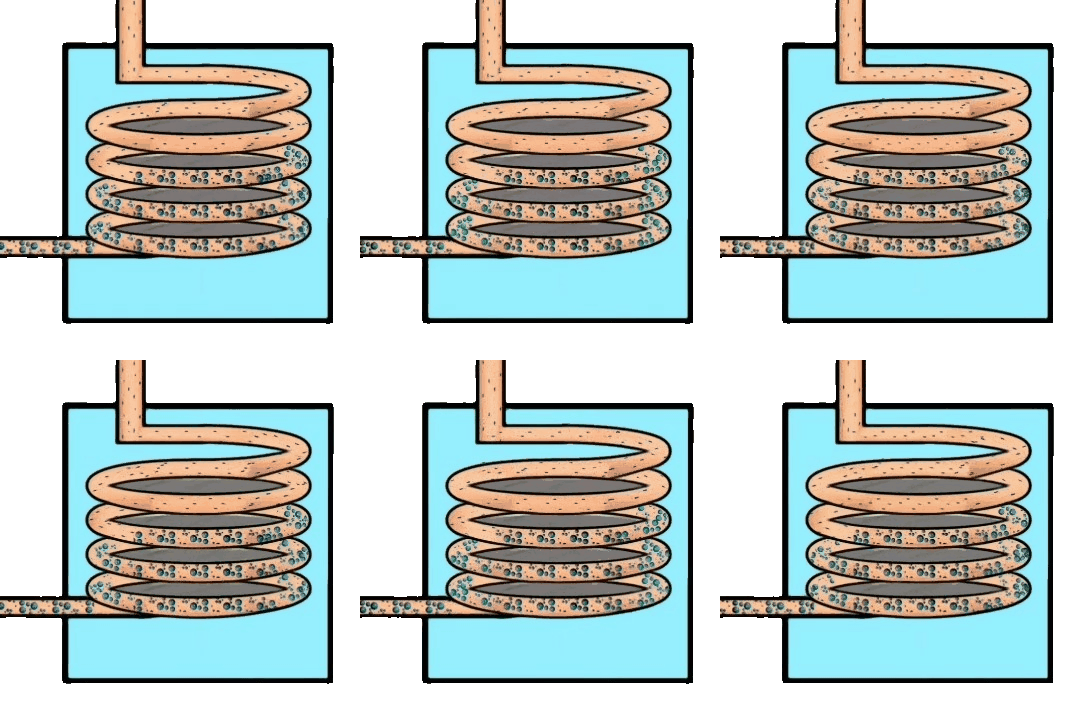
Condenser



Evaporator
T1
T5
T4

T2
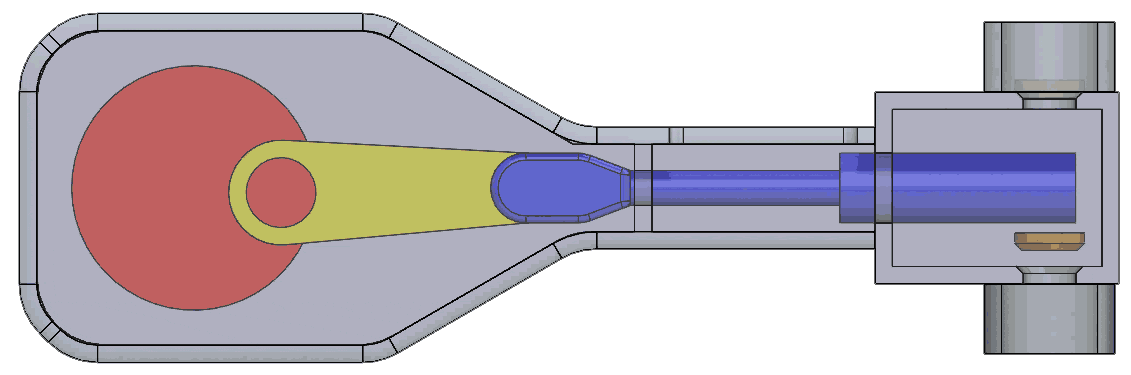
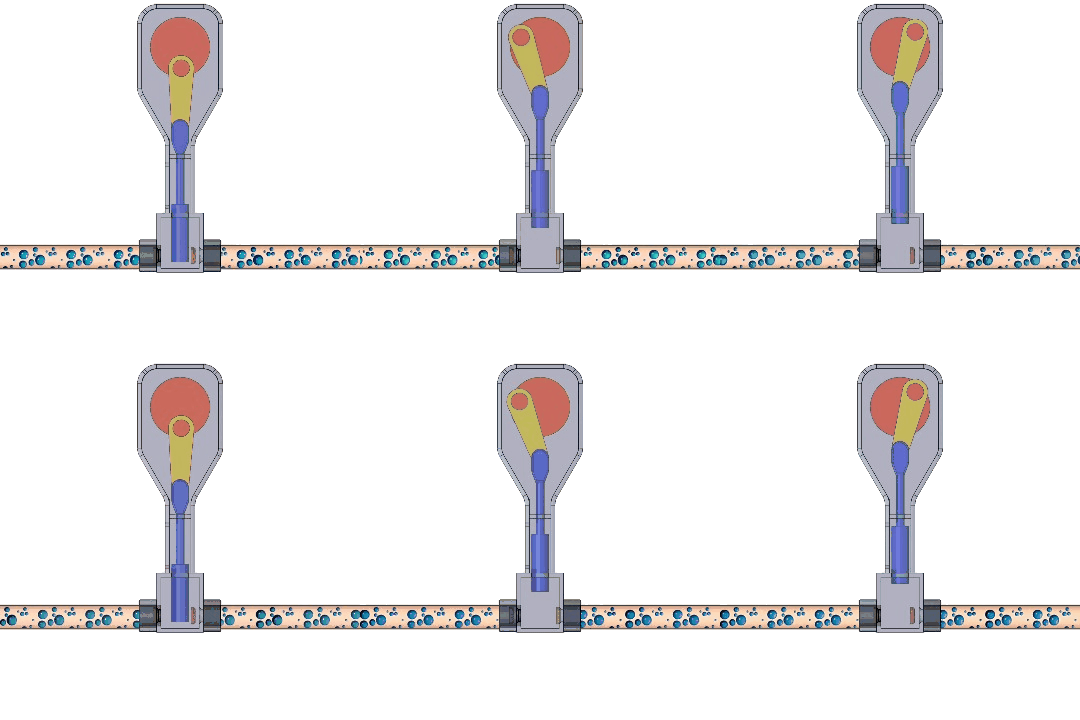
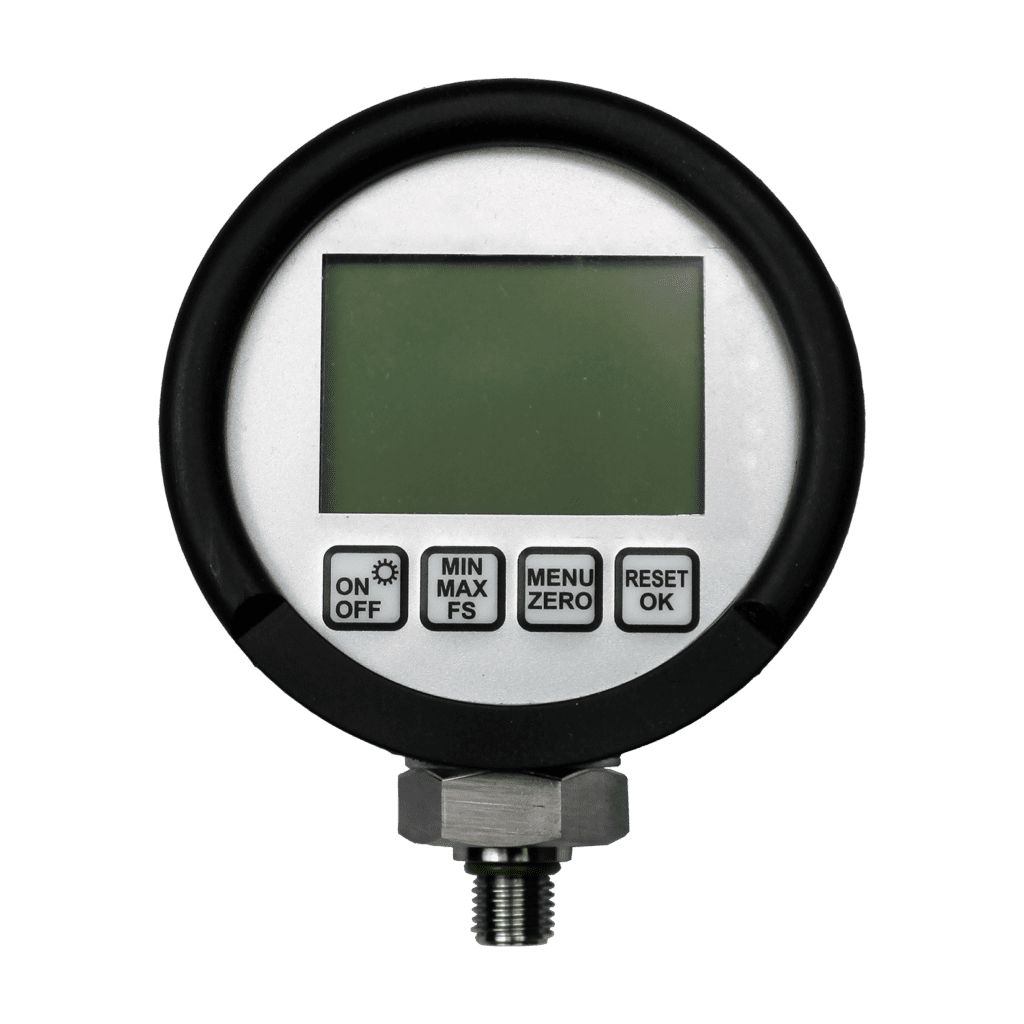
Outlet Pressure Gauge
Compressor
Inlet Pressure Gauge

Instructions
STEP 1: Click on the main switch to turn on the supply.
STEP 2: Turn on the heater switch.
STEP 3: Now, Turn on the compressor by clicking the compressor switch.
Note – The timer will start and readings will be added to the table automatically until the timer stops.
1 second in a timer is equivalent to 1 min.
STEP 4: Click on the ‘PLOT’ button to plot the graph.
STEP 5: Now, Calculate the Actual COP and Theoretical COP based on the readings and graph.
STEP 6: Click on the ‘PRINT’ button to print the simulation.
STEP 7: Click on the ’RESET’ button to reset the simulation.
STEP 2: Turn on the heater switch.
STEP 3: Now, Turn on the compressor by clicking the compressor switch.
Note – The timer will start and readings will be added to the table automatically until the timer stops.
1 second in a timer is equivalent to 1 min.
STEP 4: Click on the ‘PLOT’ button to plot the graph.
STEP 5: Now, Calculate the Actual COP and Theoretical COP based on the readings and graph.
STEP 6: Click on the ‘PRINT’ button to print the simulation.
STEP 7: Click on the ’RESET’ button to reset the simulation.
CONTROLS
FORMULA
$$1. \space Refrigerating \space Effect
(Heater \space Energy \space Consumption)$$ $$
= {Final \space Reading \space (F_h) -
Initial \space Reading \space (I_h) \over Time}$$
$$2.\space Work\space(Compressor \space Energy \space Consumption)$$ $$={Final \space Reading \space (F_c) - Initial \space Reading \space (I_c) \over Time}$$
$$3.\space Actual \space COP={{Refrigerating \space Effect}\over Work}$$
Observation table
| Sr. No | Time (Min) |
T1 (°C) |
T2 (°C) |
T3 (°C) |
T4 (°C) |
T5 (°C) |
Comp. I/P(W) |
Heater I/P(W) |
P1 (PSI) | P2 (PSI) |
|---|
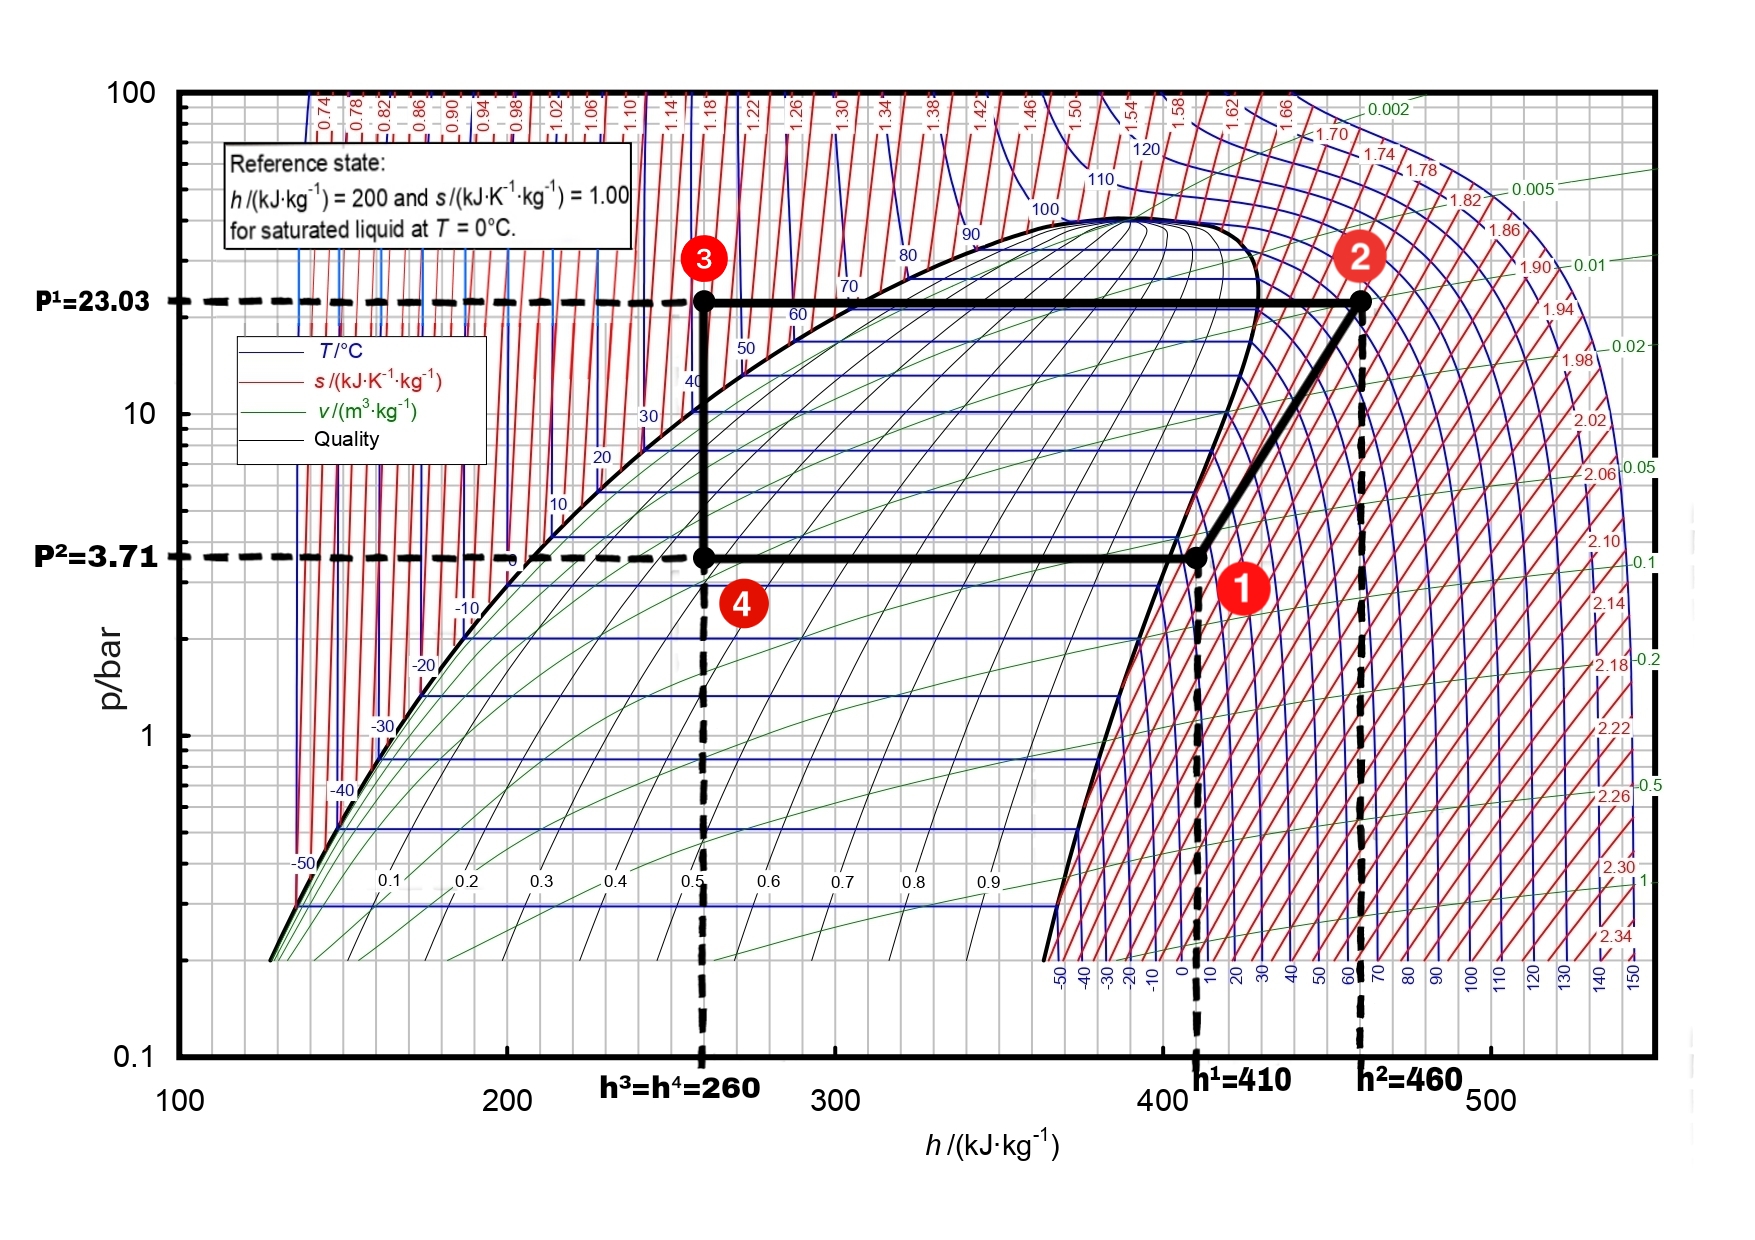
Theoretical Calculations
(1).png)
actual Calculations
Graph
Pressure v/s Enthalpy